

How’s The Market? Real Estate in the North Okanagan in 2013
2013 is over.
Let’s have a look at the year that was in real estate.
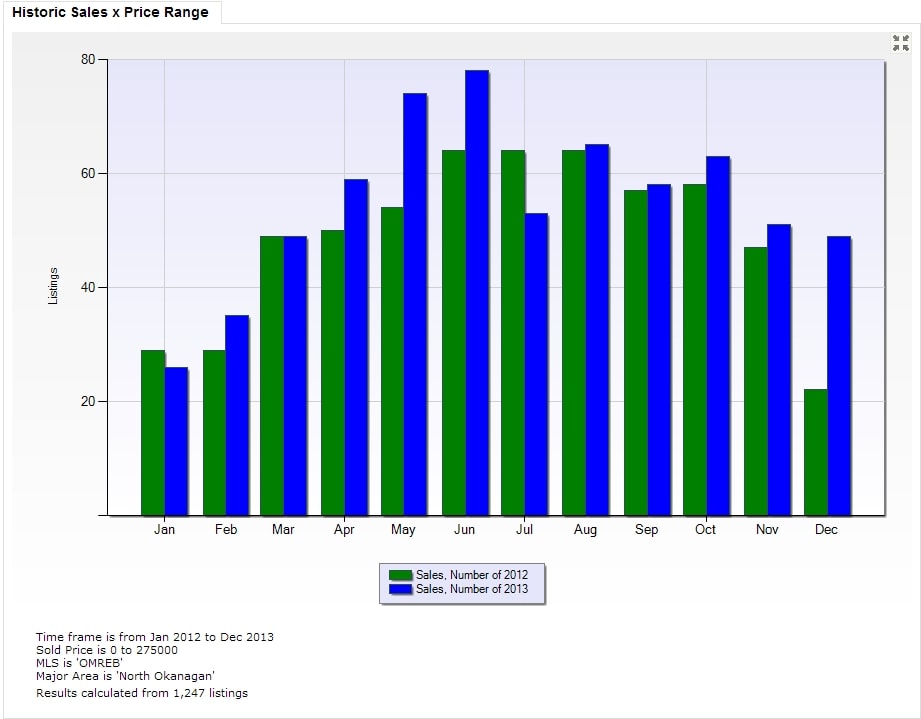
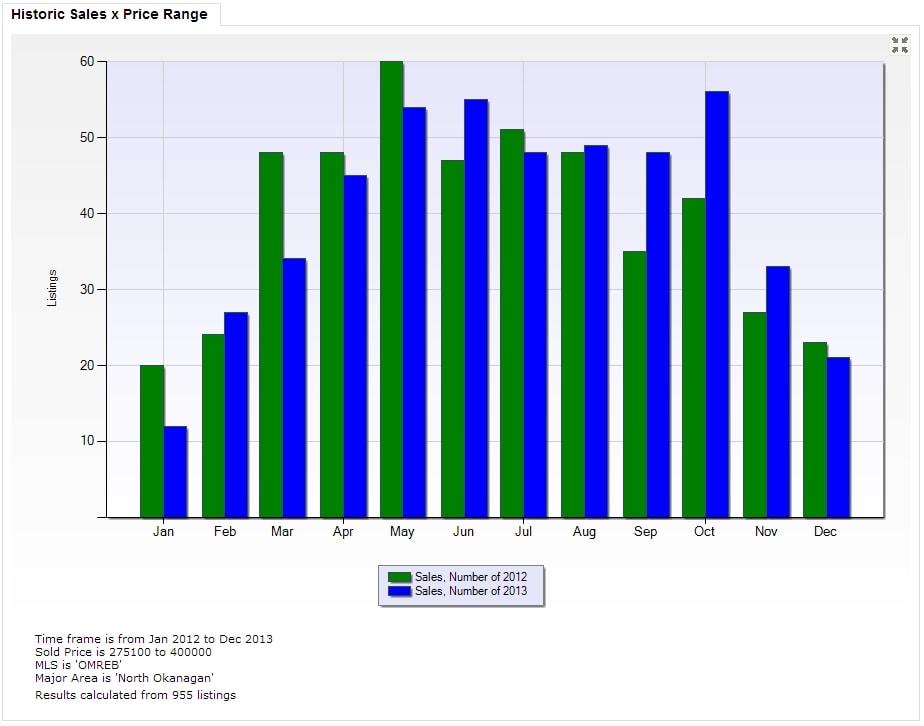
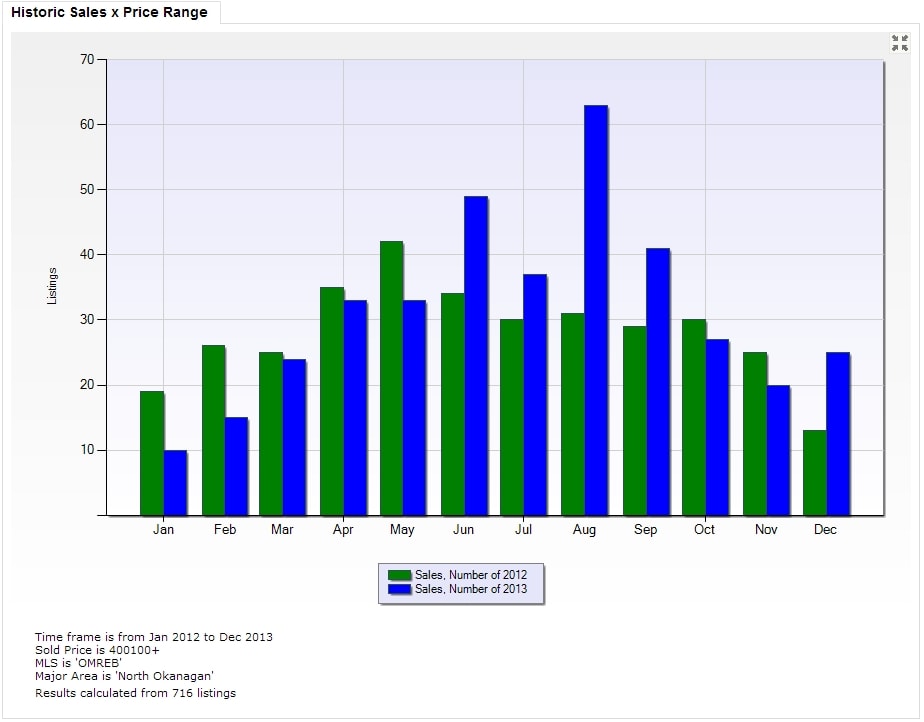
Below are three charts comparing the number of sales in the North Okanagan each month in 2012 and 2013.
Those happy blue lines? Those show the sales in 2013.
I sure like seeing that increase in activity in the second half of the year. It’s a great indicator of what’s to come.
Real estate sales up to $275,000
Real estate sales between $275,000 and $400,000
Real estate sales from $400,000 and up
Many have been wondering if the market is going to drop even more, and my prediction is no.
With sales increasing at this rate, prices are sure to follow.
If you’ve been waiting to make that real estate investment in the North Okanagan, now would be a great time to jump in, while prices and mortgage rates are still low.
If you’re thinking about jumping, I’m here to help. Call me and let’s get started!